Learn efficient ways to extract quantities and volumes from a well-structured SketchUp Pro model
SketchUp Pro has long had important features for extracting quantities and volumes of objects with quality: the Outliner (Outliner) window and the Generate Report (Generate report) function. Although these tools are known to most SketchUp Pro users, they need to be used correctly for the quantity extraction to produce good results.
In this post, you will see an example of how a correctly structured model allows you to extract data in various ways, easily and quickly. We believe that studying this example can serve as a reference for you to analyze the structures used in your models and encourage you to make adjustments, when necessary, in order to obtain reports with data relevant to the development of your projects.
The study model
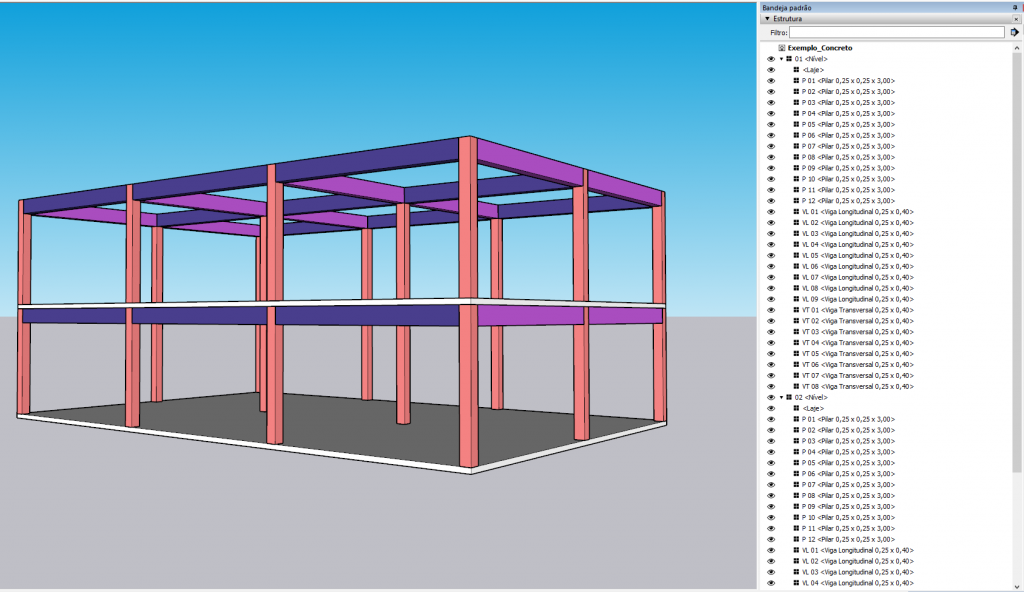
The model used represents a two-story (level) reinforced concrete structure, made up of slabs, columns, and beams, as shown in Figure 1.
The model was structured according to the following premises:
- All objects were created as components.
- The two levels are instances of the same component, that is, this example makes use of a typical floor. The first floor was named 01<Level>, and the second, 02<Level>.
- Each type of object (slab, column, transverse beam, and longitudinal beam) that is part of the typical floor was given a Definition Name (Definition Name) according to its identity and dimensions. The columns, which are all the same size, were named Column 0.25 x 0.25 x 3.00. If there were columns with other dimensions, these would be represented by other components, with other names.
- Each object instance was given, when relevant, names that identify it according to its position within each level. For the columns, the naming convention used was P 01 through P 12. The numbers 01 through 12 identify the location of the columns on both levels. The same naming rule was applied to the transverse and longitudinal beams.
- All objects were classified according to the IFC 2x3 schema: slabs as ifcSlab, columns as ifcColumn and transverse and longitudinal beams as ifcBeam. Levels were classified as ifcBuildingStorey, following the definitions of the ISO 16739:2013 standard, which presents the IFC specification used by SketchUp Pro.
Based on a model structured this way, it is possible to extract quantities in several ways. In this example, we will see how to extract the concrete volume of the structure, organizing the results according to the rules stated below:
1. Grouping resulting quantities and volumes by slabs, columns, and beams, using the IFC classification assigned to the objects
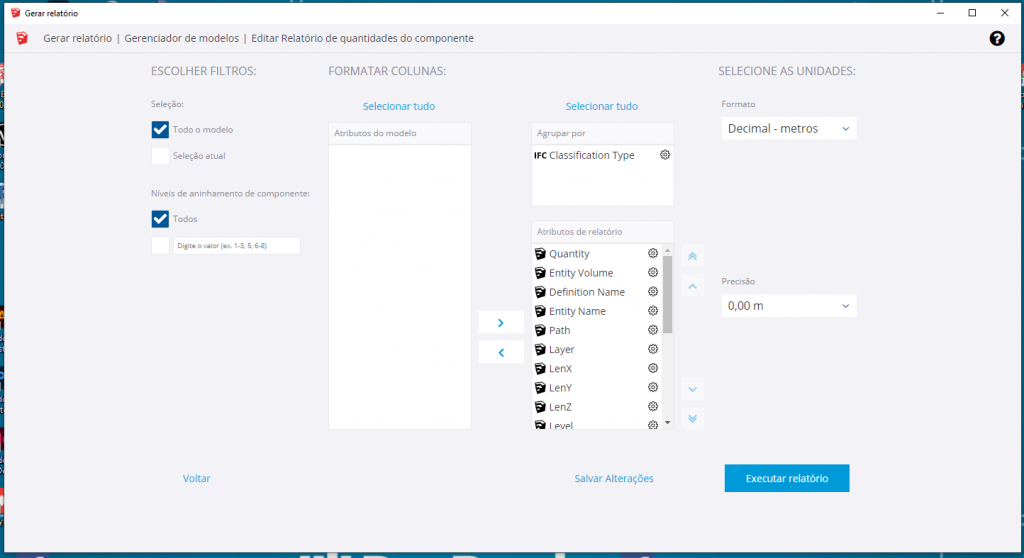
In the Generate Report window, make the adjustment as shown in Figure 2. Note that the IFC Classification type attribute is placed in the Group by (Group by) box, while the other attributes go into the Reference Attributes box. To make the results easier to interpret, we suggest following the order Quantity, Entity Volume, Definition Name, and Entity Name.
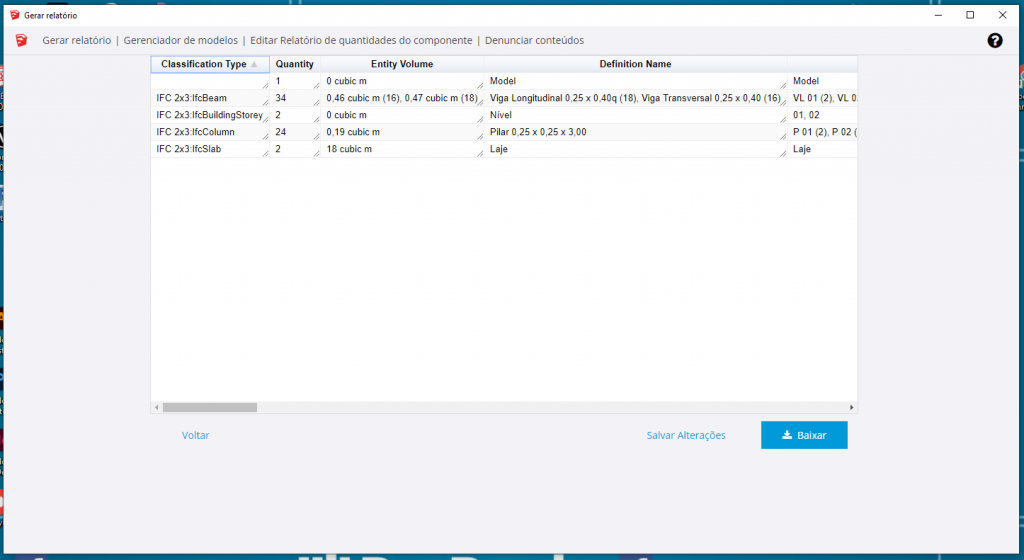
The report will be exported as shown in Figure 3.
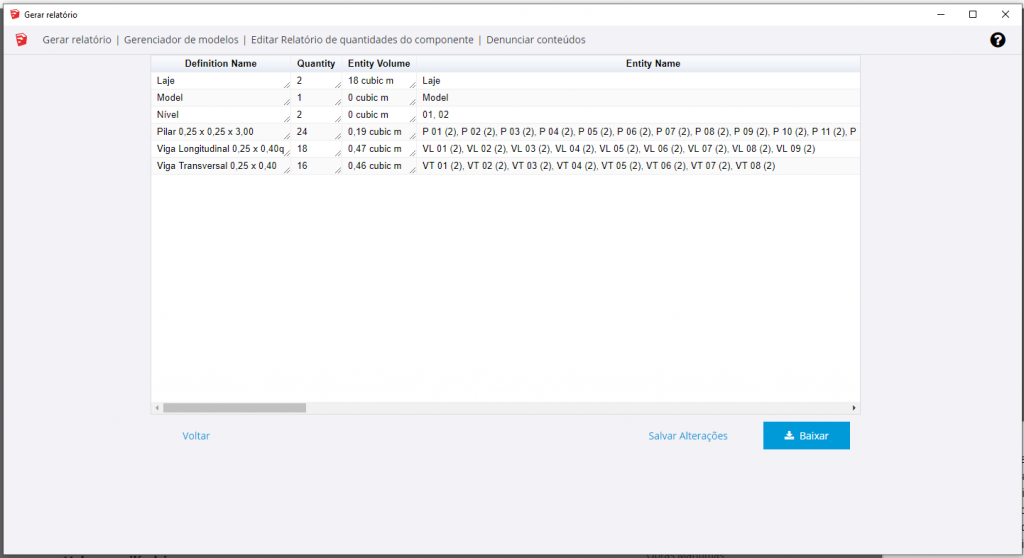
2. Grouping resulting quantities and volumes by their Definition Names (Definition Name), which allows objects to be separated by their typologies.
Grouping this way is useful for breaking down, or detailing, a takeoff done using the IFC classification criterion, as suggested in item 1. In this example, this happens with the two types of beams, which have different dimensions but belong to the same IFC class (ifcBeam).
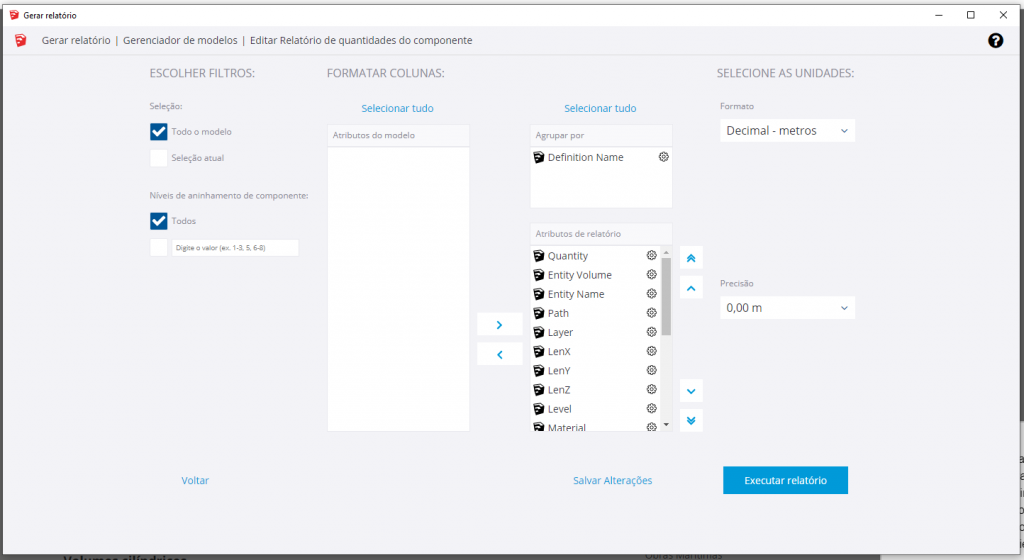
In the Generate Report window, make the adjustment as shown in Figure 4. Note that the Definition name attribute is placed in the Group by (Group by) box, while the other attributes go into the Reference Attributes box. To make the results easier to interpret, we suggest following the order Quantity, Entity Volume and Entity Name.
The report will be exported as shown in Figure 5.
3. Grouping resulting quantities and volumes by Entity Names (Entity Name)
This way, it is possible to obtain, for example, the grouped volume of columns P 01, P 02, etc., taking into account all the levels where they are located.
In the Generate Report window, make the adjustment as shown in Figure 6. Note that the Entity name attribute is placed in the Group by (Group by) box, while the others go into the Reference Attributes box. To make the results easier to interpret, we suggest following the order Quantity, Entity Volume and Definition Name.
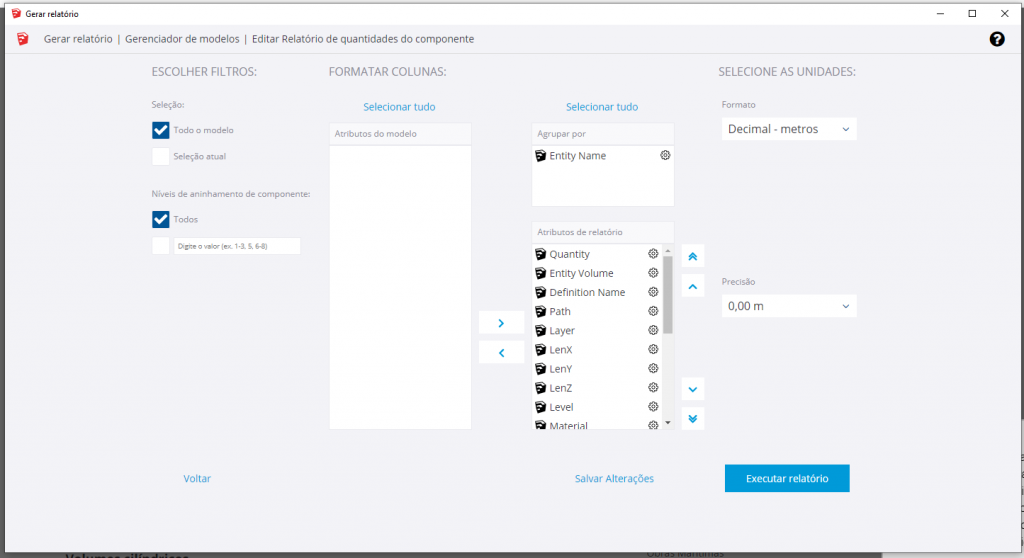
The report will be exported as shown in Figure 7.
4. Listing each model item separately
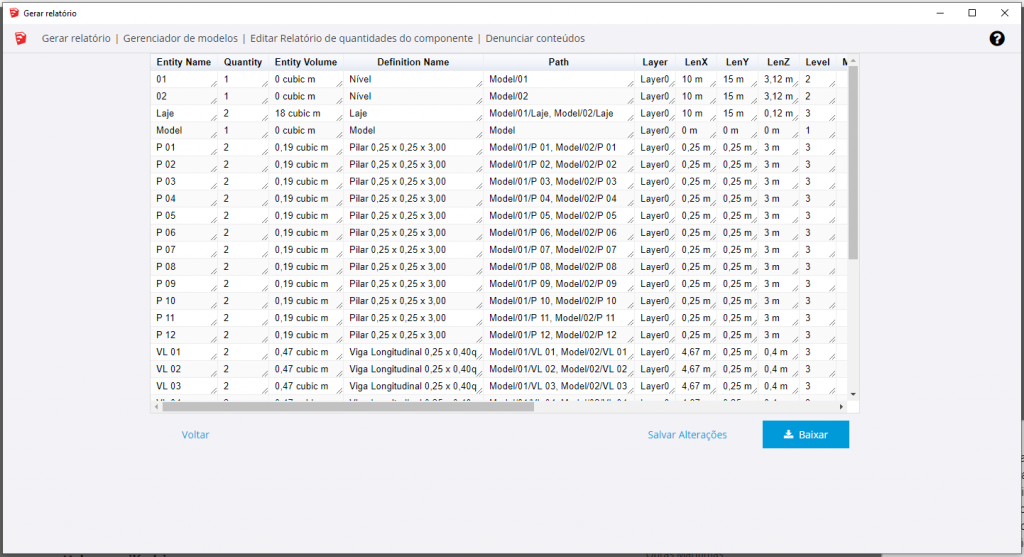
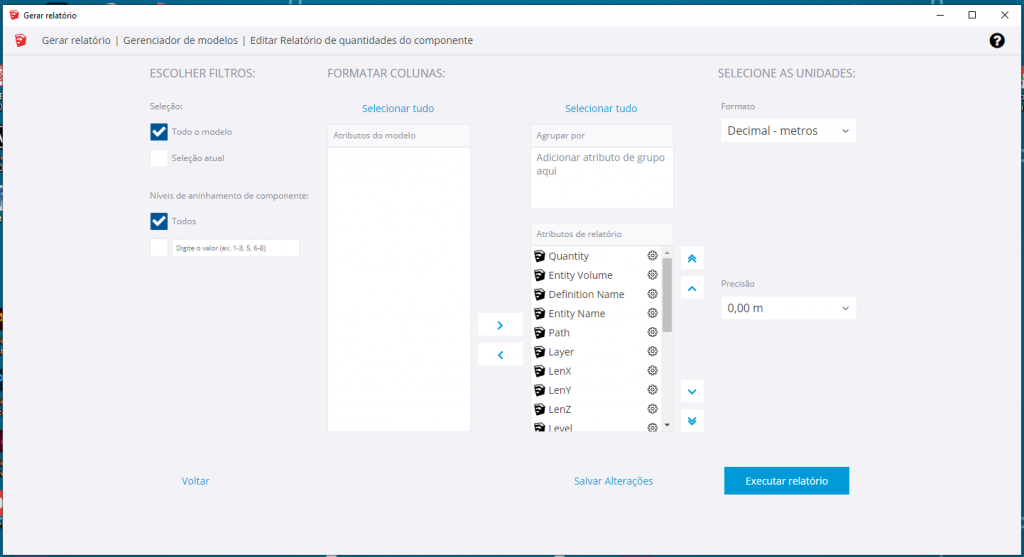
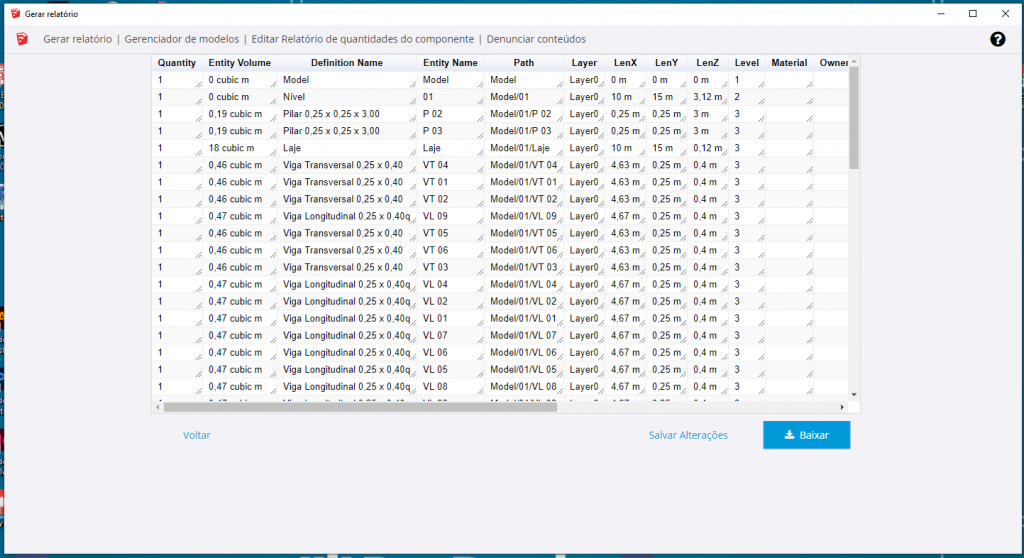
This data extraction method produces a list with one item description per row. This allows for more detailed analysis in a spreadsheet editor, such as Excel, using tools like Subtotal or Pivot Table.
In the Generate Report window, make the adjustment as shown in Figure 8. Note that no attribute should be placed in the Group by (Group by) box, meaning all attributes go into the Reference Attributes box. To make the results easier to interpret, we suggest following the order Quantity, Entity Volume and Definition Name and Entity Name.
The report will be exported as shown in Figure 9.
Conclusion
The purpose of this post was to show how easy and quick it becomes to export data from a SketchUp Pro model when it is structured in a comprehensible way, with clear premises guiding the organization of objects. We believe that, by seeing how easily different results can be obtained from a well-structured model, making just a few adjustments in the Generate Report window, you will be able to reflect on how to structure your models so as to generate reports with consistent, and therefore relevant, data for the development of the most varied types of projects.